

Episode 87 was recorded at 4.30 EST on Thursday 17th September, 2026. Rob Connors of The Crude Chronicles joins Benny and the Squirrel to explain why he doesn’t count barrels, why the marginal cost of production is the only number that matters in oil, and why he thinks crude is heading to $240 before this cycle is done!
We get into the well productivity slowdown that signals rising development costs, the “China collar” and the renminbi signal, why big tech’s trillion-dollar capex binge is a replay of big oil in 2013, the refining secondary-unit squeeze, and where we are in the energy equity cycle (inning four or five, with parabolic euphoria still ahead).
Show Notes
Framework: productivity, not barrel counting
Rob’s view was shaped by three mentors: one on history, one on secular oil price direction, one on stock picking via incentive structures.
Core philosophy: 99% of Street research is “barrel counting” (supply vs demand), which captures short-term moves but misses long-term cycles.
Evidence: year-over-year oil supply and demand growth have tracked each other since 1866 (1970s demand growth went from +8% to -1% while oil rose from ~$5 to ~$35; the 2000s saw steady matched growth but oil went from ~$10-15 to $140). Supply always meets demand; what matters is the marginal cost of the barrel called upon.
The Eureka Chart (Minute 5)
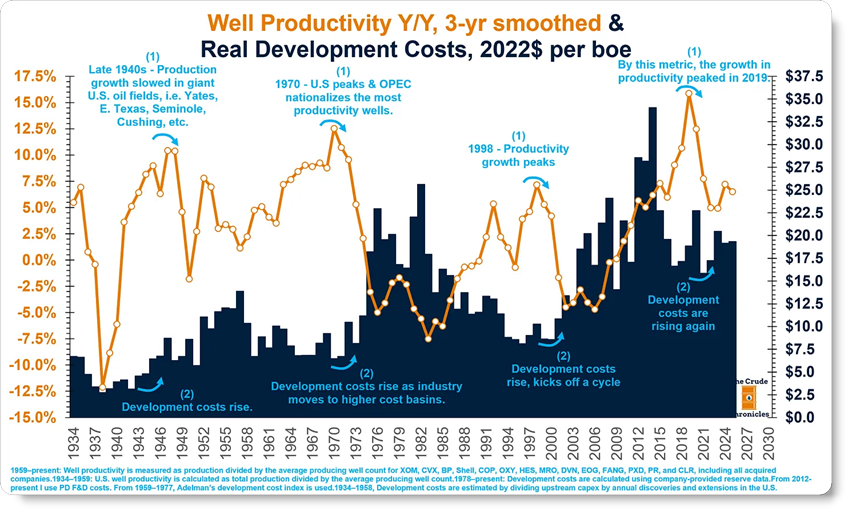
Well productivity (oil output divided by producing well count) is the key long-run metric, built from company disclosures.
When productivity growth slows, development costs for the marginal barrel rise; non-OPEC well productivity growth (June/July) is the slowest ever outside of recessions, implying development costs must rise and the industry shifts to higher-cost basins.
Analogy: unit labor costs, i.e. productivity growth of 14% vs cost growth of 5% is a positive spread; when productivity slows below cost growth, the economics flip.
The development cost index has roughly a 0.9 r-squared to oil prices back to 1932, the strongest model he has found.
Marginal cost framework (Minute 8)
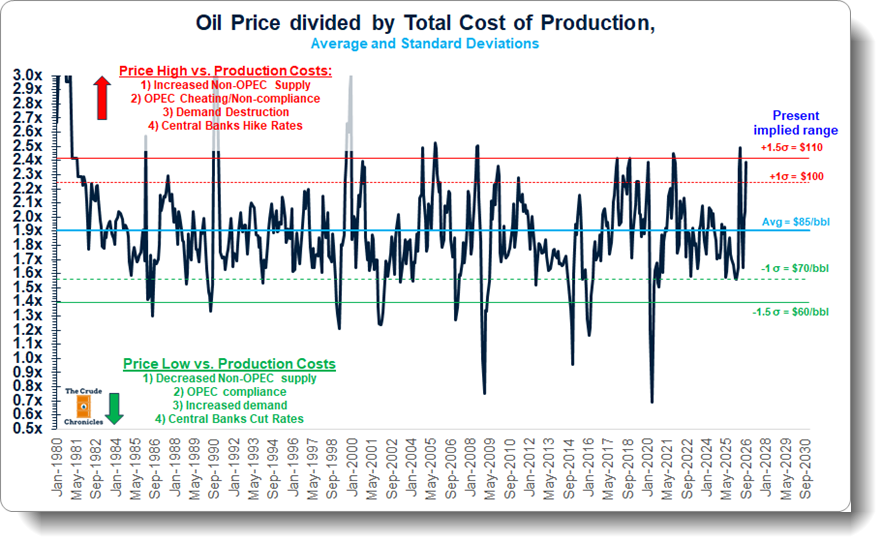
Production costs are backed out of company disclosures (Exxon, Chevron, BP, Shell, Total and predecessors like Mobil, Texaco, Gulf), combining finding and development costs, lifting costs, and taxes; cost of production vs oil price shows ~0.94 R-squared since 1978.
Saudi Arabia: lifting plus F&D around $11/bbl, but high tax take. Running large fiscal and current account deficits (as now) raises their marginal cost requirement, supporting the bull case.
Oil price divided by marginal cost defines the trading range: when price is high relative to cost, four things follow (rising non-OPEC supply, OPEC cheating, demand destruction, central bank hikes); the reverse set signalled his bullishness in June and September last year, before the Iran conflict.
Current read: oil looks “peaky-ish” around $110, floor near $70 absent a COVID or GFC-style shock; he is not selling because “you never sell oils in September,” with the seasonal exit point being spring.
Dollar, liquidity and the global credit (Minute 13)
Weak dollar is still needed for oil to do well; a strong dollar sucks global liquidity and acts as global tightening.
Best gauge is world M2 translated into US dollars; global money supply bottomed mid-2025 and has been accelerating since.
Risk: the Fed is back in a tightening cycle, and historically oil stocks get roughly an eight-month runway before going wobbly; the 1999-2000 “double tightening” (ripping dollar plus hikes) is the cautionary template.
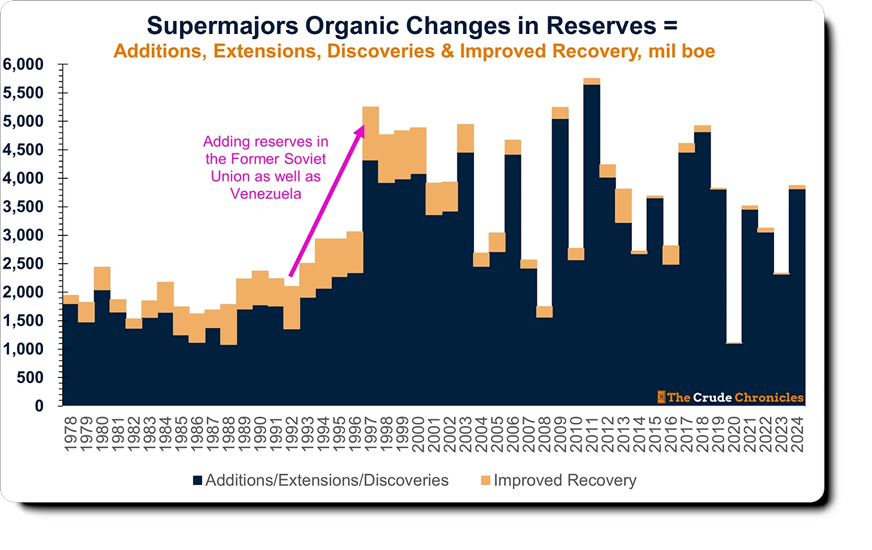
Historical digression: the 1990s oil bear market lasted about seven years longer than it should have because former Soviet Union supply (Lukoil F&D costs around $0.40/bbl) collapsed the marginal cost; growth-minded, nationalization-scarred majors reinforced it. Venezuela is the modern parallel supply risk.
Incentive structures: oil vs tech (Minute 20)
Investor-led reform shifted oil exec pay to free cash flow, returns on capital employed, and TSR benchmarked against the S&P 500, not just peers; this disciplines capital allocation because PMs allocate across all 8,000+ listed companies, not within sectors.
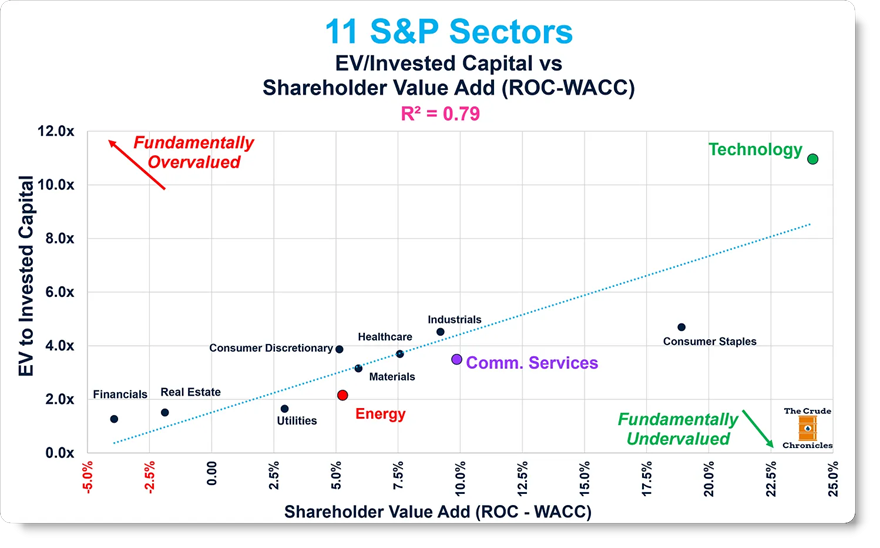
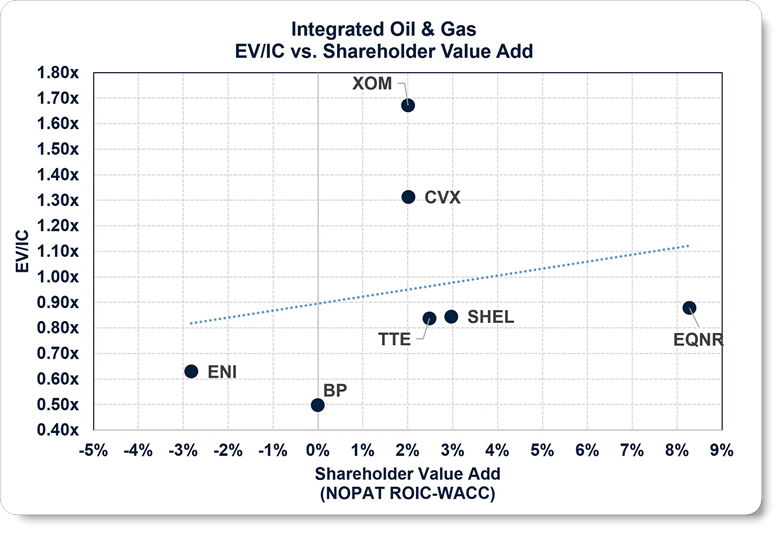
Tech’s incentive structures (Amazon, Google, Microsoft, Apple, Meta) are 100% growth-based with no capex control or ROCE metrics; over $1 trillion of capex mirrors exactly where big oil was in 2013-14 when ~50% of E&P pay was tied to reserve and production growth.
“You pay them to build data centers, they’re going to build data centers.”
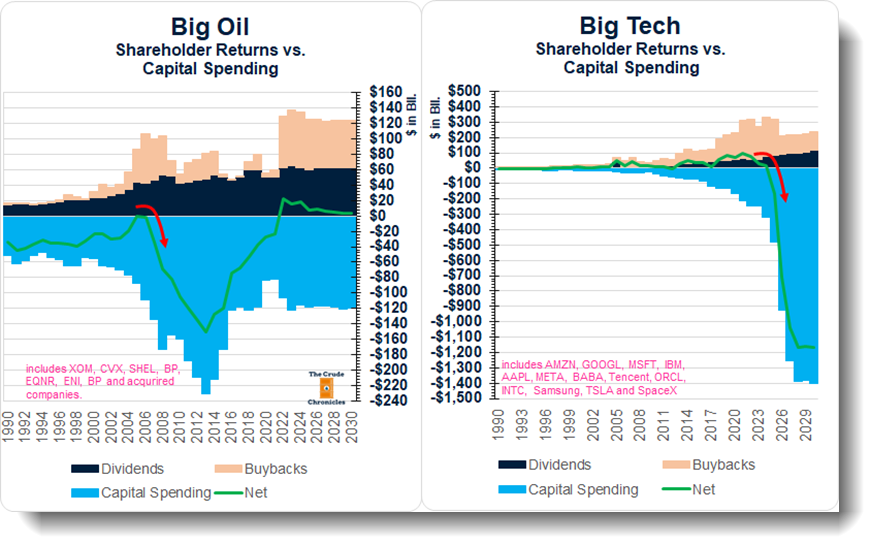
Shale wells and GPUs share the same profile: roughly 80% of value captured in the first 18-24 months.
Refining and secondary units (Minute 27)
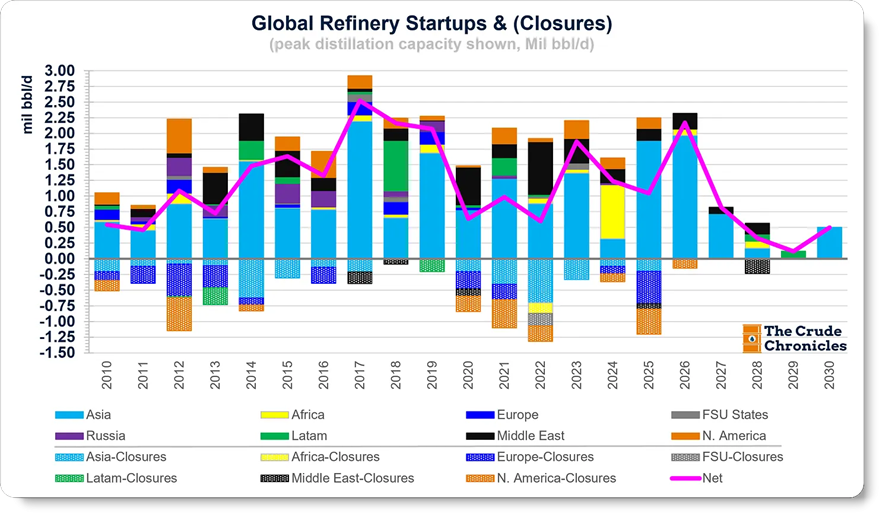
Refiners have the best incentive structures in oil and gas (post-2008 bust, separation from majors, capex control, buybacks), which is why no new US greenfield refinery since 1977 and why refining is a “rock star” now.
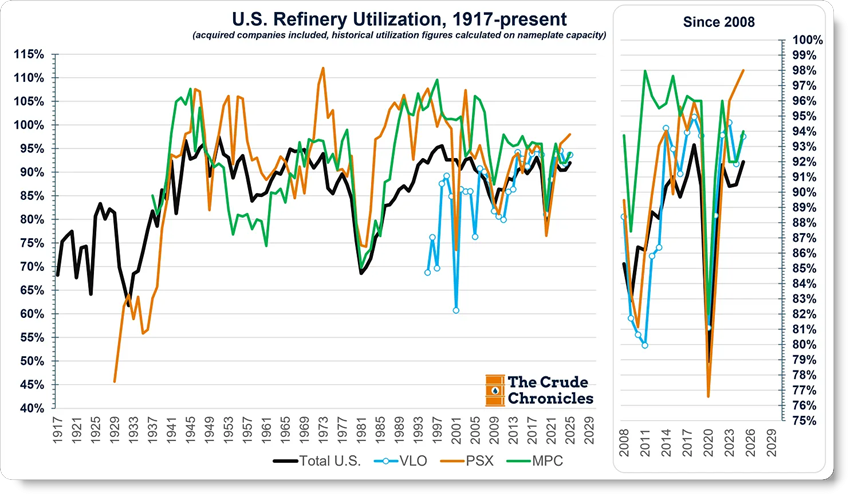
Common throughput-over-nameplate utilization misses the point; profits come from secondary units that upgrade bottom-of-the-barrel material into gasoline, jet, and diesel.
Light product demand is set to grow roughly three times faster than secondary unit capacity; Atlantic Basin closures (Europe, East and West Coast) and China’s EV-driven halt to refinery building compound it.
The Iran war removed medium-heavy crudes that are best for distillate; Venezuela and Canada help but not enough, which is why distillate cracks are so strong.
China collar and the RMB Signal (Minute 31)
🐿️ asked for Rob’s view on his “China collar” theory (monopsony buying power capping and flooring the crude price) - he gives it credence because oil tends to bottom when the RMB strengthens; USDCNY has firmed from ~7.3 in April 2025 to ~6.7.
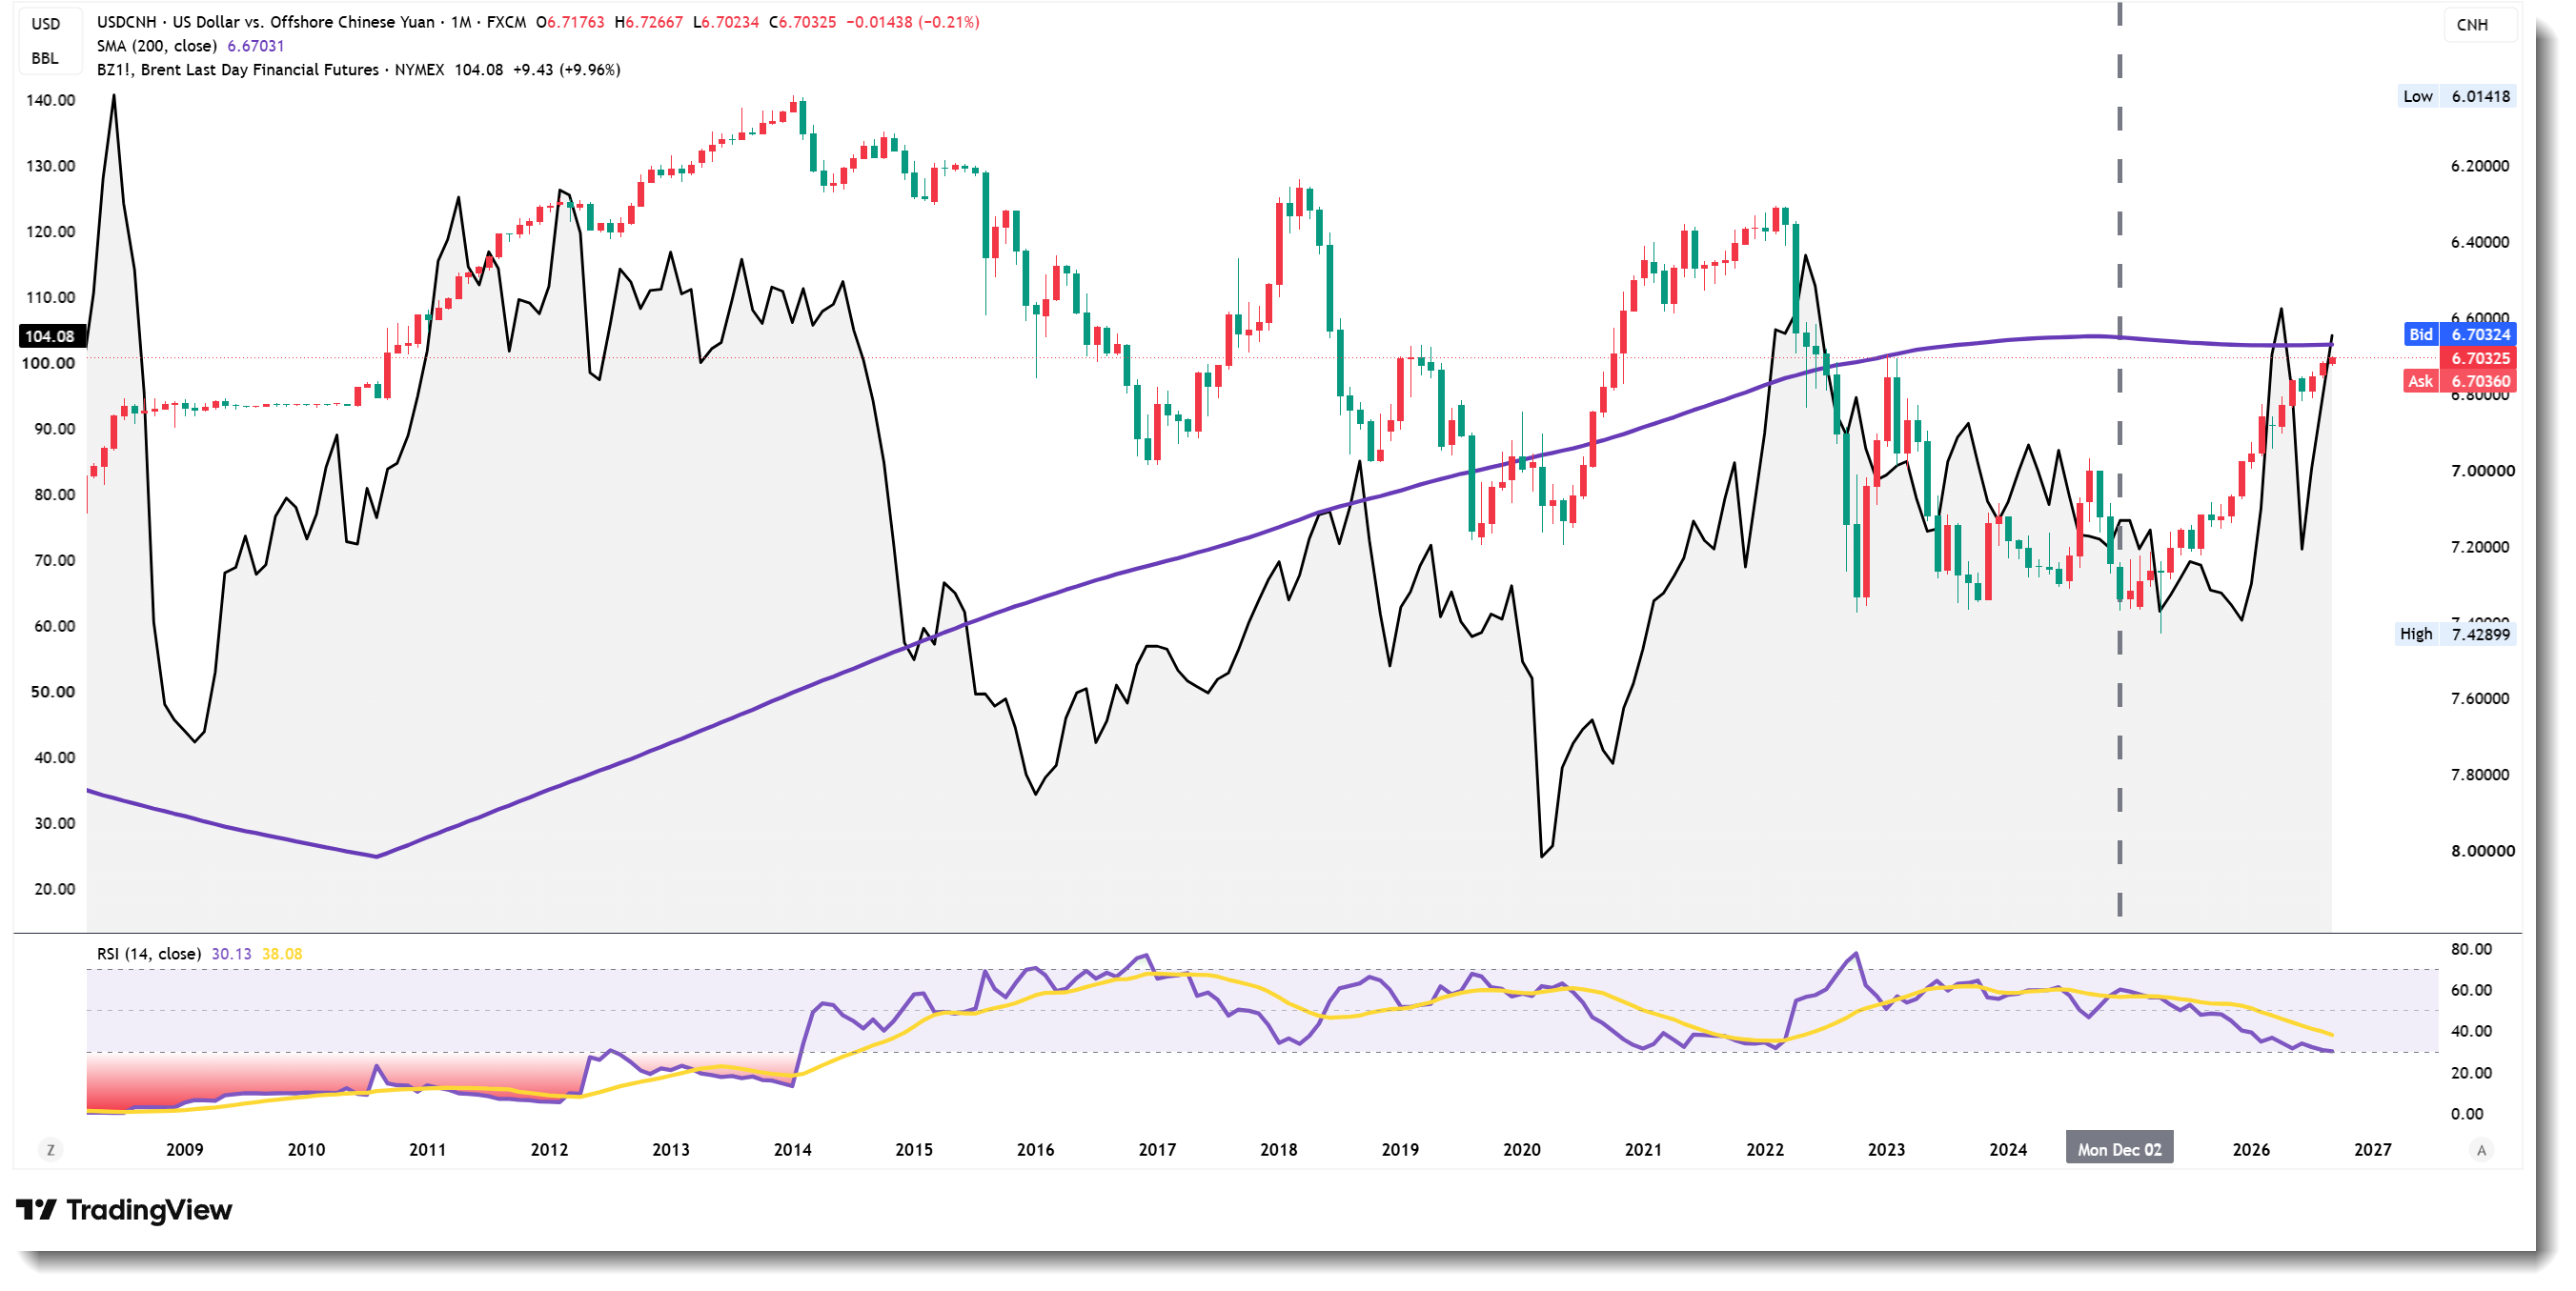
Rule of thumb: buy what China is buying (gold, then barrels), stop making things that China starts making - LLM tokens may have the same commoditization risk.
Energy equities: cycles and positioning (Minute 34)
Energy is ~3.5% of the S&P 500; Rob puts the equity cycle in “inning four or five” of his DOPE (Doubt, Optimism, Parabolic & Euphoria cycle). Doubt wave ran from 2020 to 22. We are in the Optimism phase, anticipating a pullback ahead of Euphoria.
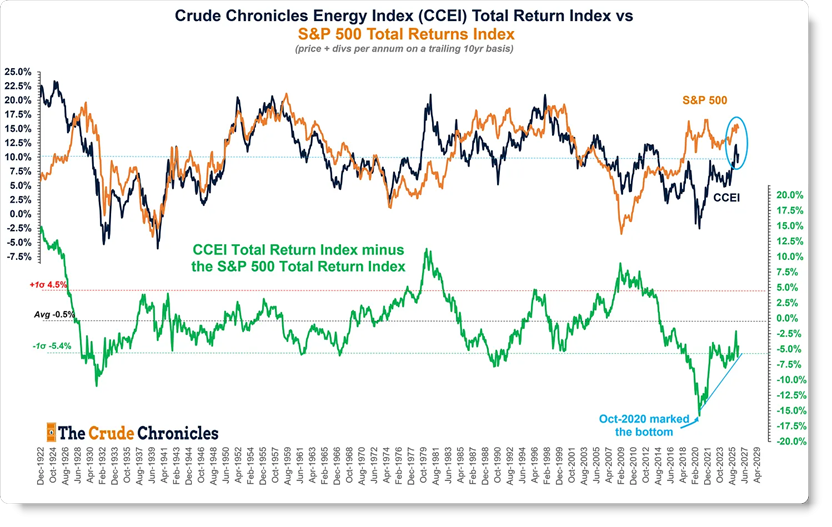
Note that in the Euphoria phase, own offshore drill ships and oilfield services: producer discipline breaks and value transfers to capex receivers.
Drillship fleet consolidation chart: that 1990s bubble was Venezuela’s Lake Maracaibo barge rig build-out, which triggered the Venezuela-Saudi spat and eventually Chavez.
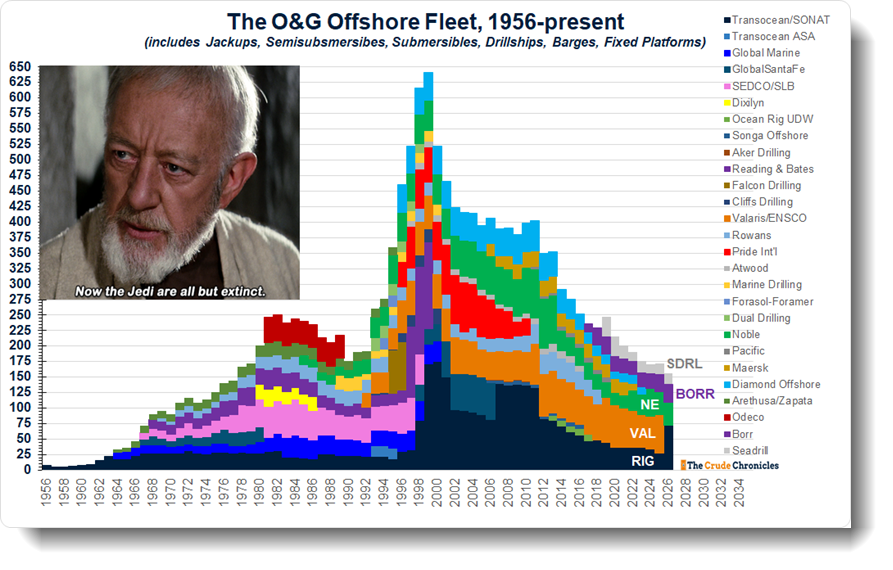
Transocean’s incentives have finally shifted from uptime/day rates to free cash flow; day rates bottomed in 2019-20 at ~50-55% utilization.
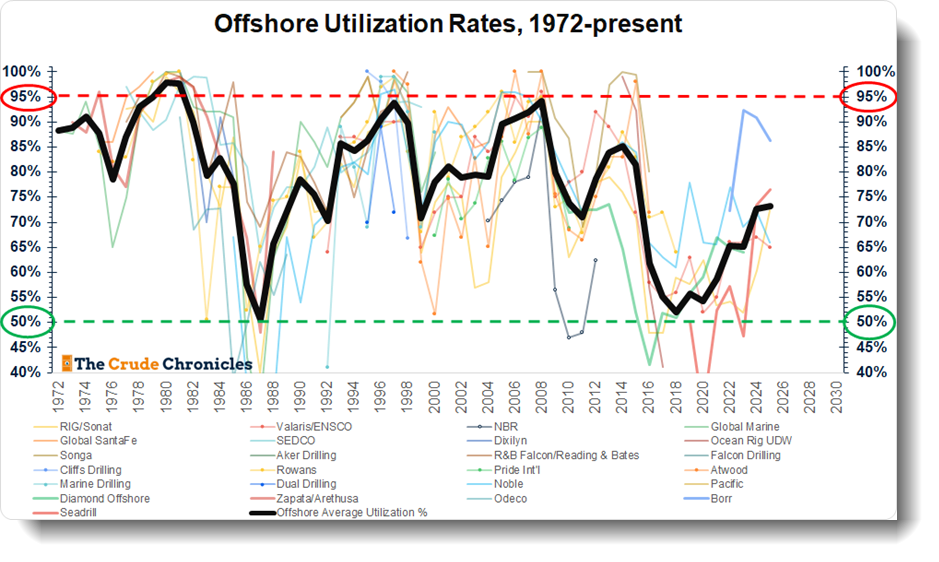
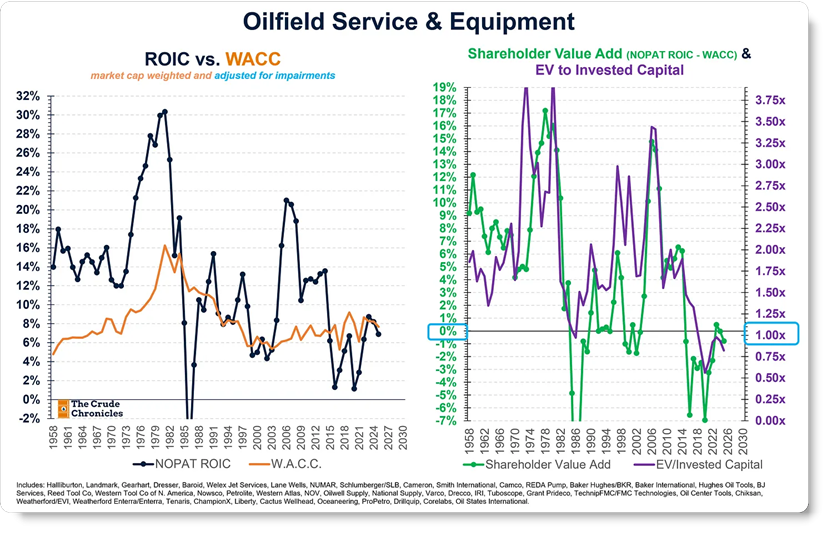
Offshore operating leverage is underappreciated: late-cycle profits go parabolic as fully depreciated old assets (1970s boats by 1978-79, 1970s jack-ups in the 2000s) return to work; today’s parallel is North Sea semi-submersibles and a re-engaged BP - an opportunity for Transocean RIG 0.00%↑.
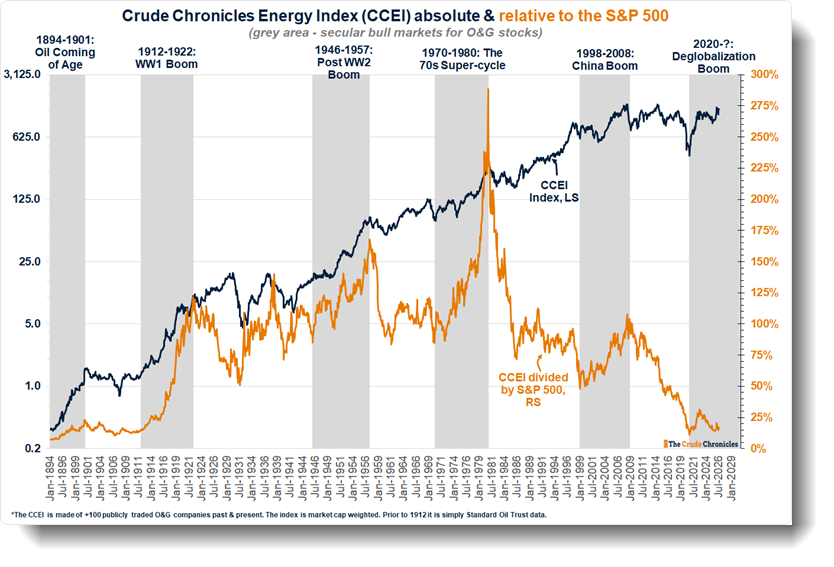
Long-term target: oil eventually moves towards $240, the inflation-adjusted 2008 high; development costs historically CAGR at mid-teens (14-18%) through upcycles, and energy could return to ~10% of the S&P 500 (vs ~30% in the 1970s), a threefold move in weight.
Sell signals to watch: oil to the top of the oil-to-SPX logarithmic channel, and producer returns on capital back to the 20-25% level where every cycle peaks.
On pullbacks: capital discipline plus rising marginal cost puts the floor near $70; his Crude Chronicles Energy Index shows 2023-25 was the first bear market where earnings declines merely matched (not exceeded) oil’s year-over-year decline.
Valuation anchor: oil and gas market cap at ~7.5% of US nominal GDP implies 6-8% real (double-digit nominal) annual returns over the next decade; R-squared of 0.62 since 1912 (0.71 excluding the 1970s). Keeps him bullish but grounded.

If you act on anything provided in this newsletter, you agree to the terms in this disclaimer. Everything in this newsletter is for educational and entertainment purposes only and NOT investment advice. Nothing in this newsletter is an offer to sell or to buy any security. The author is not responsible for any financial loss you may incur by acting on any information provided in this newsletter. Before making any investment decisions, talk to a financial advisor.


